Contract management dashboard: examples, benefits, and KPIs
02/06/2026
9 min read

For modern enterprises, effective contract lifecycle management (CLM) is impossible without real-time visibility and actionable intelligence. Trying to monitor risk, compliance, and contract performance through static reports and scattered spreadsheets is a direct path to missed renewals and lost contract value.
The solution is a robust contract management dashboard that transforms your entire agreement portfolio into a dynamic, strategic asset, providing stakeholders with the precise metrics that enable data-driven decisions.
In this guide, we show you how to get started with the best dashboard examples and contract key performance indicators (KPIs) you should track.
Key highlights:
- A contract management dashboard is a centralized, visual interface that translates complex agreement data into clear insights teams can act on.
- Tracking the right contract metrics, such as cycle time, renewal rates, value leakage, and obligation fulfillment, helps organizations optimize performance and reduce risk.
- Conga CLM provides configurable, role-based contract dashboards and powerful reporting tools that give teams the visibility, control, and intelligence needed to manage deals at scale.
What is a contract management dashboard?
A contract management dashboard is a centralized, real-time view of your contract lifecycle, presented through visual components such as charts, tables, scorecards, and metrics. It aggregates information from your CLM system into a format that’s easy for teams to understand, monitor, and act on.
According to an EY Law study, 35% of organizations surveyed have already adopted analytics tools to analyze their contracting processes. A dashboard provides immediate visibility into key contractual information, allowing stakeholders to track performance, identify risks, monitor compliance, and make data-driven decisions that improve efficiency and reduce potential losses.
Contract management dashboard examples
Different stakeholders—such as executives, the legal team, and sales personnel—require distinct views and specific contract intelligence. The most effective contract dashboards focus on a few key metrics relevant to the user's goals.
Let's review three contract management dashboard examples from Conga CLM.
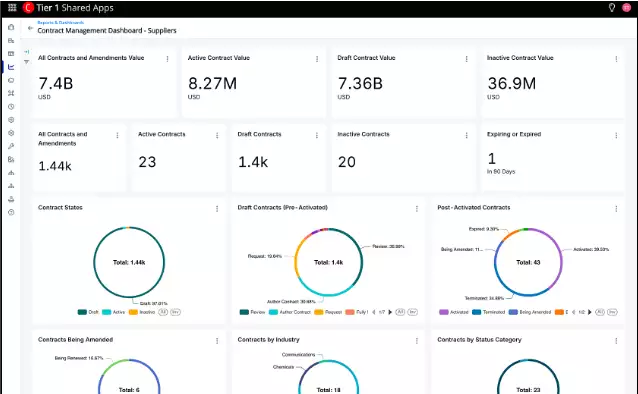
1. Contract performance dashboard
A contract performance dashboard provides a real-time view of where agreements sit in the lifecycle, offering clear insight into stage distribution and overall portfolio activity. It shows how many contracts are active, drafted, expired, or amended, supporting better workload planning and early issue identification.
This dashboard can also segment agreements by industry, status category, and post-activation stage, surfacing trends that guide prioritization and contract renewal strategy. With precise visibility into each contract’s position, your team can address delays quickly, focus on high-value work, and keep the contract pipeline progressing smoothly.
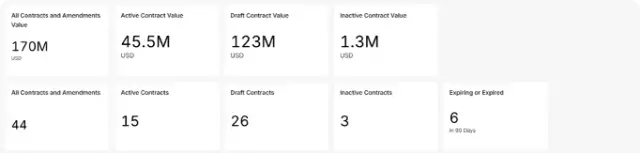
2. Executive dashboard
An executive dashboard delivers a high-level view of contract performance across the organization, summarizing financial exposure, deal volume, and portfolio health in real time. It highlights total agreement value, the distribution across active, draft, and inactive stages, and the overall mix of agreements in the pipeline.
This view surfaces critical insights at a glance. In this dashboard example, executives can immediately see the $170M portfolio value, the $123M concentrated in draft, and the six agreements nearing expiration. These contract management KPIs enable leadership to assess risk, prioritize renewals, and make informed strategic decisions without diving into operational detail.
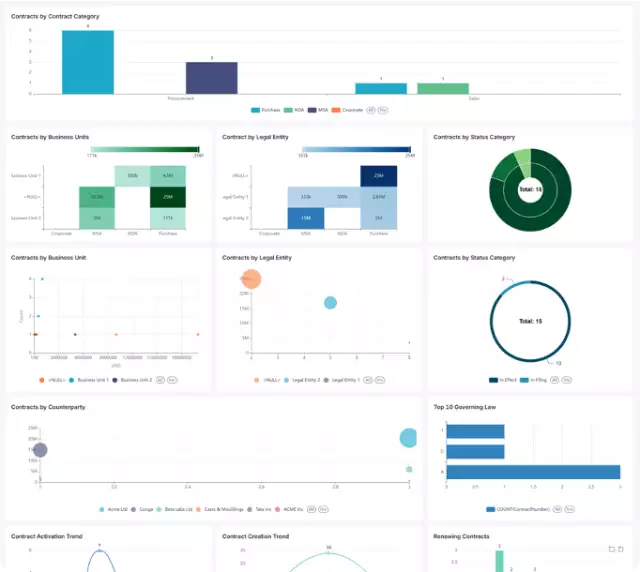
3. Legal performance dashboard
A legal performance dashboard gives legal and compliance professionals the visibility they need to manage contract risk, track obligations, and maintain portfolio-wide compliance. It consolidates key structural insights—contract volume by category, legal entity, business unit, and counterparty—through clear visualizations, such as bar, scatter, and donut charts.
This view also highlights critical risk and governance indicators. Users can see which contracts are in effect versus in filing, identify top governing jurisdictions, and understand where legal exposure concentrates across the business. With this clarity, legal teams can address compliance gaps, evaluate risk distribution, and support timely, defensible decision-making.
Watch our webinar to explore the power of contract reporting and dashboards with Conga CLM:
7 key benefits of contract management dashboards
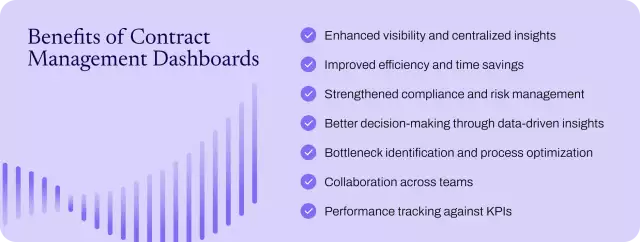
Contract management dashboards improve speed, alignment, and decision-making across the entire CLM workflows. Benefits include:
Enhanced visibility and centralized insights
Fragmented contract data makes it difficult to assess agreement value, supplier exposure, or status without tedious manual searches. Dashboards eliminate these silos by creating a single source of truth for every agreement and status update. With a unified, real-time view, teams instantly see total contract value distributions, supplier concentrations, and lifecycle activity, delivering critical insights instantly to authorized users.
Improved efficiency and time savings
Manual contract management reporting drains hours of work every week—pulling data, updating spreadsheets, and reconciling mismatched versions—delays drafting, review, negotiation, and approvals. Dashboards automate tracking and refresh data in real time, removing the need for manual report creation.
Strengthened compliance and risk management
When obligations, renewals, or expiration dates live in different places, organizations face compliance gaps, auto-renewal penalties, and unnecessary exposure. Contract dashboards make it easy to monitor contract risk indicators such as upcoming expirations.
Automated alerts prevent missed renewals, while risk scoring and clause-pattern tracking help legal teams address potential issues early, preventing them from escalating into disputes. According to Gartner, the ability to proactively safeguard the contract portfolio is a growing priority for legal leaders: 9% of general counsel now cite advanced contract analytics as a key solution for improving oversight and reducing costs.

Keep learning: How legal teams strengthen compliance and obligation management.
Better decision-making through data-driven insights
Lack of clear visibility into cycle times, value leakage, and contract utilization trends limits teams’ ability to plan, forecast, and prioritize effectively. By visually surfacing agreement metrics, dashboards enable more objective, data-backed decision-making.
Bottleneck identification and process optimization
A lack of workflow visibility makes it difficult to pinpoint where contracts get stuck, whether during legal review, approvals, or negotiation. Dashboards highlight stalled stages and slowdowns, giving teams the data they need to address the common pain points of inefficient contract management. The result is faster cycle times and smoother, more predictable processes.
Collaboration across teams
Misalignment between sales, legal, procurement, and finance often comes from working with different versions of information or a lack of visibility into each other’s workloads and priorities. Role-based dashboards in contract management give every team a shared, reliable source of truth. The result: cross-functional alignment, faster approvals, and reduced friction.
Performance tracking against contract management KPIs
Without a precise mechanism to track contract performance, organizations struggle to evaluate the effectiveness of their CLM workflows. Dashboards let teams monitor contract KPIs in real time, including cycle time reduction, obligation fulfillment, and negotiation speed.
Unlock the benefits of contract dashboard with Conga CLM
22 contract lifecycle management metrics and KPIs you should track and add to your dashboard
A well-structured contract management KPI dashboard should include metrics to measure efficiency, performance, compliance, and risk. This way, you can better identify bottlenecks, prevent revenue leakage, strengthen governance, and ensure every agreement delivers its intended value.
Get started with these 22 common KPIs for contract dashboards:
| Focus area | Common KPIs for contract dashboards | How it's calculated | Importance |
| Process efficiency | Contract cycle time | Time spent from the first draft to the signature | Revealing end-to-end efficiency and spotting negotiation or approval slowdowns |
| Approval time | Length of internal contract review queues | Highlighting internal review bottlenecks and streamlining workflow routing | |
| Signature velocity | Time between sending a contract for signature and complete execution | Assessing eSignature workflow efficiency and stakeholder responsiveness | |
| Redline volume | Number of revisions or redlines per contract | Indicating negotiation complexity and template quality | |
| Time-to-approval by stage | Time spent in drafting, legal review, and finance review | Diagnosing where the workflow slows down | |
| Contracts by owner | Count of deals grouped by contract owner | Supporting resource allocation and workload balance | |
| Contracts by lifecycle stage | Number of agreements in draft, review, negotiation, signature, active, etc. | Showing real-time progress and pipeline distribution | |
| First-time acceptance rate | Percentage of contracts accepted without revisions | Measuring template effectiveness and negotiation efficiency | |
| Contract performance | Contract value leakage | Expected value minus actual realized value | Identifying lost revenue from missed renewals, pricing errors, or SLA failures |
| Renewal rates and timing | Percentage of contracts renewed plus on-time renewal performance | Indicating retention, continuity, and predictability of renewals | |
| Contracts expiring soon | Count of deals approaching expiration | Preventing lapses, service disruptions, and auto-renewal exposure | |
| Spend under management | Percentage of spend governed by active contracts | Showing procurement maturity and cost control | |
| Contract values by type | Contract value segmented by non-disclosure agreements (NDAs), master services agreements (MSAs), and statements of work (SOWs) | Enabling strategic planning and portfolio analysis | |
| Clause revision frequency | Number of times clauses are modified | Highlighting negotiation patterns and non-standard clause areas | |
| Contract value realization | Actual realized value divided by contracted value | Measuring whether agreements deliver expected results or not | |
| Contract risk score distribution | AI-generated or rule-based risk scoring | Helping legal teams prioritize review and mitigation | |
| Non-standard term frequency | Percentage of contracts with custom clauses | Indicating exposure from deviations to standard templates | |
| Missed milestones/obligations | Count of unmet contractual obligations or delayed deliverables | Signaling compliance gaps and potential disputes | |
| Compliance and governance | Obligation fulfillment rate | Obligations met on time ÷ total obligations | Indicating post-signature performance and accountability |
| Compliance rate | Percentage of contracts meeting internal and regulatory requirements | Supporting audit readiness and reducing legal exposure | |
| Audit trail completeness | Percentage of contracts with full version history, approvals, and changes logged | Ensuring audit readiness and transparency | |
| Contract accessibility and completeness | Percentage of deals stored with all metadata, attachments, and signatures | Guaranteeing data quality and speeding up contract reporting |
Watch our webinar to learn more about the power of contract metrics for legal teams.
Choose Conga CLM for all your contract management reporting needs
With configurable dashboards, flexible reporting, and deep lifecycle insights, our contract lifecycle management solutions give teams a single source of truth for every agreement.
Conga lets you build contract dashboards that reflect your business processes while maintaining tight control over who can access what. You can control access to your dashboards and reports by storing them in public, hidden, or shared folders, ensuring the correct information reaches the right stakeholders without compromising security.
Our CLM dashboard capabilities include:
- Role-based views that surface relevant KPIs for legal, sales, procurement, and executive teams
- Drill-down reporting to explore contract details, lifecycle stages, and historical activity
- Real-time metrics covering cycle times, approvals, renewals, obligations, and risk indicators
- Flexible filters and customization so every user can analyze data the way they need
- Scalable governance controls that support compliance, audit readiness, and cross-functional transparency
Optimize your agreement portfolio with clarity and control. Contact our sales team to see how Conga CLM dashboards can transform your contract management analytics.
Frequently asked questions
-
What types of reports can I create using a contract management dashboard?
Contract management dashboards allow you to build reports that track contract lifecycle metrics, performance KPIs, and process efficiency. Common types include:
- Process efficiency reports: tracking contract cycle time, time-to-approval by stage, and signature velocity
- Financial and performance reports: detailing total contract value, revenue leakage, and spend under management
- Risk and compliance reports: highlighting contract risk score distribution, non-standard term frequency, and obligation fulfillment rates
- Role-specific views: configurable dashboards tailored for different teams, providing executives with portfolio oversight, legal teams with risk and compliance insights, and operations with efficiency tracking
-
Are contract dashboards included in enterprise CLM software?
Yes. Most enterprise contract management software includes prebuilt dashboards and reporting capabilities. Solutions such as Conga CLM offer configurable dashboards designed for legal, sales, procurement, and executive teams, along with governance controls to manage access. Users can create reports, customize dashboards, store them in public or private folders, and monitor performance in real time without relying on IT.
Read more: why contract lifecycle management software is key for enterprises?
-
How do dashboards support contract renewals and expirations?
Dashboards support contract renewals and expirations by transforming static contract data into proactive, actionable insights, giving teams centralized visibility into upcoming deadlines and renewal opportunities. For example, you can create dedicated visualizations that track:
- Agreements expiring in the next 90 days: showing exactly how many contracts are approaching expiration, helping teams prioritize outreach and renegotiations
- Agreement value by stage: donut charts segment contract value across lifecycle stages (in authoring, in signatures, in effect), highlighting the financial impact of renewal-eligible contracts
- Number of agreements by status category: visual breakdowns of contracts in forecast, pre-authoring, and other stages, giving renewal teams insight into pipeline health and workload distribution
- Agreement value by quarter: time-series views of activated agreement values across quarters, enabling finance and sales teams to forecast renewal revenue and spot seasonal patterns
These charts use color-coding to indicate urgency, enabling teams to act quickly where it matters most. Automated alerts notify contract owners and stakeholders, ensuring teams manage renewals proactively, prevent missed opportunities, avoid unwanted auto-renewals, and reduce the risk of service disruptions.

-
The contract management strategy you might be overlooking BlogCLMThe contract management strategy you might be overlooking
Discover the contract management strategy that improves collaboration, clarity, and results—without overcomplicating your process.07/15/20255 min read -
Ultimate guide to contract management GuidesCLMUltimate guide to contract management
Learn more about how effective contract management can help you streamline processes, maximize deal values, and reduce risk.
10/10/20200 min read -
Conga Recognized as a Leader in Five G2 Grid® Reports BlogCLMConga Recognized as a Leader in Five G2 Grid® Reports
Conga earns G2 Leader recognition for Contract Lifecycle Management and Document Generation, including #1 rankings for Enterprise Usability and Enterprise Relationships, based on verified customer reviews.01/22/20264 min read -
Only the agile thrive BlogAIOnly the agile thrive
Discover how business agility, AI, and connected data help companies respond faster to tariff disruptions, reduce risk, and make confident go‑to‑market decisions.02/23/20265 min read